Editing Farming Operations
Version 10.0 has added the capability to edit farming operations. Users will be able to edit the charge units for supplies, people and equipment. Equipment, supplies and/or people may also be added to the previously recorded farming operation. Once an edited operation has been recorded, all records will be updated including inventory, notations and, if applicable, the enterprise statement. PLEASE NOTE: THIS OPTION IS ONLY AVAILABLE IN VERSION 10 and later.
IMPORTANT: If a farming operation cannot be removed through “Remove Farming Operation”, it cannot be edited. For example if a harvested crop has been disposed of, such as a sale or transfer, the harvest operation cannot be edited. The sale or transfer would need to be voided first to allow the operation to be edited.
 To edit a farming operation:
- Go to History Operations Maintenance.
NOTE: If using Site Pro, Operations Maintenance is available by right clicking on a field. - Highlight the farming operation(s) to be edited. Use the sorting fields at the left to narrow your selection.
For example, if you want to view only the operations that have a Type of ‘planting’ for April of 2004 – enter the Start Date as 04/01/2004, End Date of 04/30/2004 and select ‘planting’ from the Type drop down list. Select the Update List button to display only the operations that fit these restrictions. The displayed operations may be further sorted by left clicking on the column headings. For example, left clicking on the Field column heading will sort the currently displayed operations into alphabetical order by the field name. Left clicking on the Field column heading once more will sort the operations in reverse alphabetical order by field name.NOTE: To select more than one operation, hold down the or and left click on the desired operations.
 - Select the Edit button. The Farming box will appear.
- Make the necessary changes to the farming operation.
To add a supply to an operation:
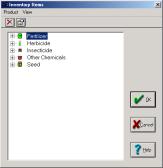 Select Add Supply from the Farming screen. The Inventory Itemscreen will appear.
- Open the appropriate supply category by left clicking on the ‘+’ to the left of the category.
Highlight the supply to be added. - Select OK to add the supply to the operation.
- Enter the application rate or total quantity used for each of the supplies added.
- Repeat steps a-e for each supply added to the operation.
 To add people or equipment to a farming operation:
- Select Add Icon from the Farming screen. The Icon Items screen will appear.
- Open the appropriate icon category by left clicking on the ‘+’ to the left of the category.
- Highlight the equipment or person to be added.
- Select OK to add the icon to the operation.
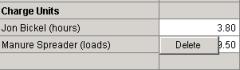
- Enter the charge units for the added icon.
- Repeat steps 1-5 for each icon added to the farming operation.
To delete an item from a farming operation:
- Right click on the name of the unwanted item within the Farming box.
- Select Delete from the right-click menu that appears.
- Select OK to record the edited farming operation.
Use the Quick Yield Import to Create a Yield Map
The Quick Yield Import box is where you will go to import yield data and create a yield map. Quick Yield Import will automatically read in the data, assign it to a layer, and create a default legend for the information.
The Quick Yield- Import Yield option is used to read yield data in many different formats. This can include data on a PC Card or memory stick (flash drive) that came directly from the yield monitor as well as yield data saved in a different format (such as a text file). The steps involved in reading yield data will vary in some ways for different types of data. This section of the manual includes general steps for reading yield data. The screens described in this section may vary slightly from the screens that you will see, but the general process will still be the same.
To create a yield map with the Quick Yield Tools:
- Select the Import Yield button from the Quick Yield Tools button bar. The Yield Import- Filename box will appear.
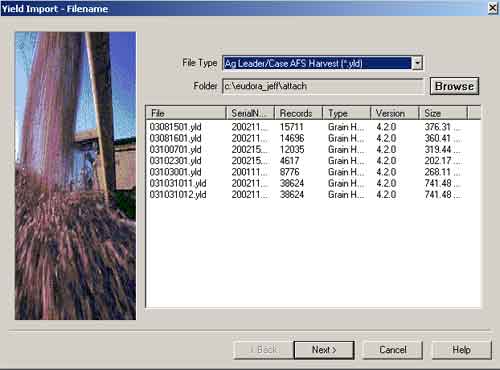
- Select the file to import. You may need to use the Browse button to select the drive and directory (or card slot) from which the files will be read. Select the Next button to proceed.
- If the program is unable to recognize the type of file you are loading, the Yield Import- File Type window will appear. Select the type of file you are importing and select the OK button to continue. Note that files that come straight from the yield monitor (usually on a PC Card) will typically be in a Binary format.
- At the Yield Import – Options box, select Harvest to import yield data and select the Next button to continue.
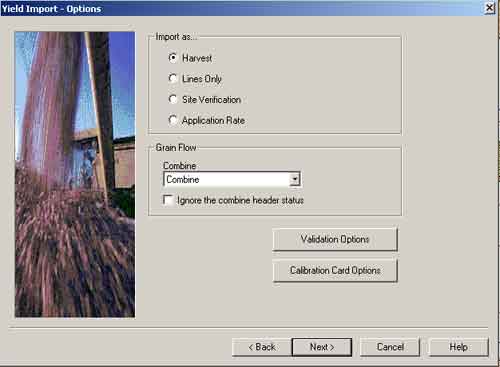
- The As Lines option can be used to import data as lines, which will connect each GPS point logged to create a map that shows the path that was covered at harvest.
- Site Verification filescan be created with some yield monitors while planting or spraying. This type of file will typically contain information such as the seed variety planted or chemical used in the Loads attribute of the file. This option will only be available if the file was created with a yield monitor that supports this data format.
- Application Ratesmay be logged with some yield monitors when they are hooked up to a planter or sprayer controller. When this option is selected, a map that appears like a yield map will be created. However, the values will be the application rates instead of yield values. This option will only be available if the file was created with a yield monitor that supports this data format.
- Select the fields for the yield data from the drop-down list in the Field column of the Yield Import – Loads box.
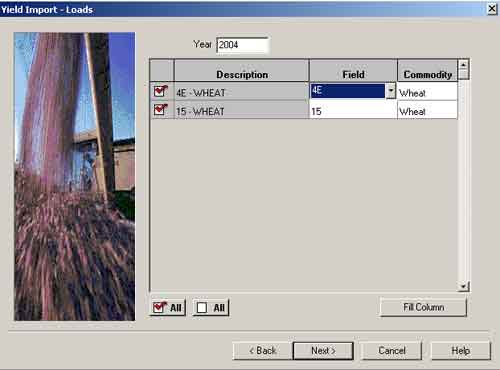
The program will display the field names that were created on the yield monitor and will ask that each field be tied to a field on the Main Farming Layer. The field names will be used for layer names as well as for reports such as the Yield Monitor Load report. Additionally, the program will use the field boundary on the Main Farming Layer to clip averaged and contoured views of yield data so they stay within the boundary of the field. If the exact same field names are used on the yield monitor, these names will automatically be selected for you. If the field has not been drawn and defined on the Main Farming Layer, select to enter the new field name. When the field is later defined on the Main Farming Layer, you will be able to select the name from the drop-down list.
- Most yield files will include wet yield with the corresponding moisture value for each logged point. To convert wet yields to dry, select the Commodity from the drop-down list that corresponds to the crop in the field. The Quick Yields Tools will generally select the appropriate crop for you.
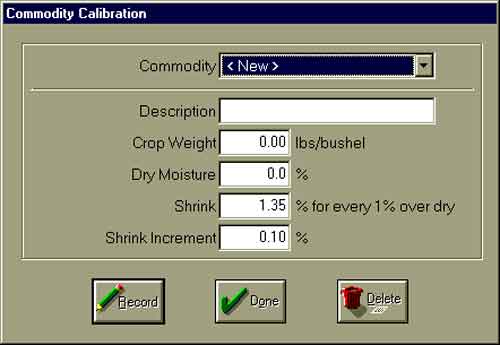
Commodities include settings that will be used to create the dry yield values for your yield map. Select from the Commodity drop-down list to set up a new commodity or change the settings for an existing commodity.
The following will be set up for each commodity:
- The Crop Weight will be used to convert the yield in the file (normally in pounds) to the desired unit of measure (typically bushels).
- The Dry Moisture is the moisture value that the program will shrink your yield down to. This value should normally match the value that your grain elevator or co-op uses when you sell grain to them.
- The Shrink and Shrink Increment percentages are used to shrink yields down to the Dry Moisture percentage. These values should normally match the percentages that your grain elevator or co-op uses when you sell grain to them.
- The Fill Column button may be used to fill a column with a selected Commodity or Field.
- The Combine settings may be used to enter delays that will be used to properly position yield data. As yield data is recorded, the values will typically be recorded with the GPS at the position where the yield strikes the sensor. This will often be a position that is not the actual position where the crop was harvested in the field.To add new combine settings or change the settings being used, select from the Combine drop-down list.
Note that multiple combine settings may be created for different combines and/or crops that have different settings. The necessary combine settings can be found in the manual for your yield monitor.The Combine Calibration box will allow you to enter the following settings:- The Combine Delay is the time in seconds that it takes the crop to get from the field to the sensor. This setting will be used to move yield points to their appropriate position in the field.
- The Start Delay is the time in seconds from when harvesting begins (normally when a combine header is lowered) until a good flow of grain begins to hit the sensor. The program will ignore the first data that is logged based on this setting.
- The Stop Delay is the time in seconds from when harvesting stops (normally when a combine header is raised) until a good flow of grain stops hitting the sensor. The program will still map this data (even though it is marked as having a raised header status
- Enter the crop Year where indicated.
- If data is being imported directly from a PC card or a diskette, select Save a copy of the card image or file to create a backup of the file on your hard drive.
A backup of the raw data is very important, since Farm Site will process the yield data and will only save the processed data on the yield layer that is created. - Select the Next button to continue.
- When the Save a copy of the card image or file option is selected, you will be prompted to enter a backup file name and to enter a destination for the file. The file name can have a large number of characters and should be a name that will help you to identify the file if you need to read it again later. As an example, the following could be used as a filename that describes the year, crop and fields in the file: 02 Bean Yield – Home#1 Home #2 & Home #3 yld.
- In the Yield Import- Layers box, select the Category from the drop-down list or select to create a new category. Normally, yield map layers will be assigned to the Yield category.
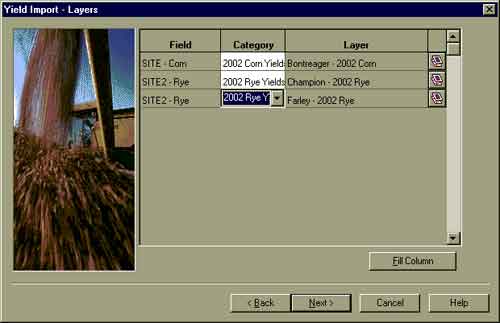
- Farm Site will automatically create a yield layer based on the field name, crop, and year that are entered. The Layers button may be used to select an existing layer or add a new layer. Select the Next button to continue.
Site Tip:You will normally import yield data for each field to a separate layer. It is best to use the default layer names created by Quick Yields. As long as the proper fields, crops and years are selected for each yield map; Farm Site will automatically combine yield maps that are created on different dates (in different files) or with different combines for the same field.
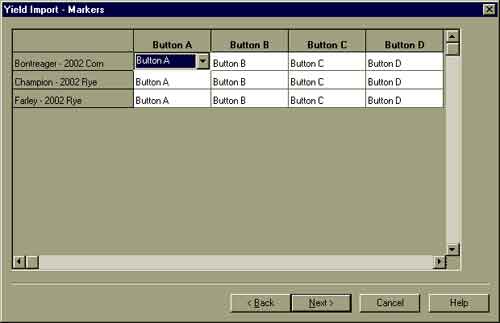
- If your yield file has “Flag” or “Marker” data, the Yield Import Markers screen will allow you to select which flags or markers you wish to import. Select the Next button to continue.
- A summary of the yield information will be displayed in the Yield Import – Finish box. Use the Back button to make changes to previously entered information, if needed.
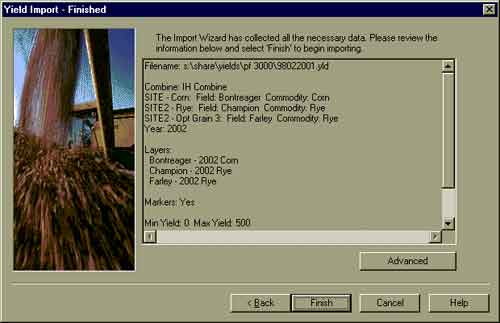
- The Advanced button can be used to enter high and low ranges for Yields and Moisture. When data is imported, the program will ignore all points that have values that are outside these ranges.
- Select the Finish button to import and display the yield map(s).
As of version 10.11, the Quick Yields program can import yield maps in the following formats:
From John Deere:
- John Deere Green Star data (*.gsy & *.gsd file) from data card.
- JD Map software JD Map Export File.
From Ag Leader or Case IH (AL-2000, PF-3000, Insight or A.F.S. *.yld, *.ilf & *.pfn):
- From Agco Fieldstar system. If you have the “Open Office” component installed on your computer, Quick Yields can read the raw data from the PC Card.
- Agco Field Star *.fsy or *.fsa data which is data saved from the Field Star office software.
- Binary data straight from a PC card or from any other drive (such as your hard drive).
- Non-binary data from a PC card that is not DOS-formatted.
Data read off the PC card with the AL-2000 software and saved in the Basic Format. - Data read off the PC card with the AL-2000 software and saved in the Advanced Format.
From Micro-Trak:
- Binary data straight from a PC card or from any other drive (such as your hard drive).
- Non-binary data from a PC card that is not DOS-formatted.
- Data read off the PC card with the Micro-Trak card reader software and saved as an MTY file.
All yield data recorded using the Ashtech Ag Navigator.
Yield data recorded using the RDS or Satloc yield monitors.
Exporting and Importing a Path from Farm Works Mobile into Mapping
Smoothing Point Data
Smoothing data is an efficient way to get more out of your yield, moisture and soil sample data. Smoothing displays an accurate picture of point-based layers through several different methods: Average, Average & Contour, Smooth, and Smooth & Contour. The different methods allow you to see patterns in your data more quickly, and decrease the amount of time required to display the layers. Use the Quick Reference Guide to determine which method might be appropriate in different situations.
|
Quick Reference |
|||
| Smoothing Method | Best Used For: | Example | Display Type |
| Average | Large Number of Points | Yield & Moisture Data | Grid |
| Average & Contour | Large Number of Points | Yield & Moisture Data | Contour |
| Smooth | Small Number of Points | Soil Sample Data | Grid |
| Smooth & Contour | Small Number of Points | Soil Sample Data | Contour |
Using the Average Method
The Average method of smoothing will give your map a gridded appearance: each grid square will be filled with the average of the data points within that grid. It is best to Average data when dealing with a large number of points within a small area, yield maps, for example. The Average method calculates all points within each grid square, add the data together, and divides by the number of points. Averaged views load faster than Base Data.
To smooth data using the Average Method:
- Click on the Smoothingbutton found on the Layer Tools toolbar.
- In the Smoothing box, select Average as the Method, and then select the Layer to smooth. This will default to the Active Layer.
- If the layer has data for more than one field, select the Field to be averaged. Select to average all data on the layer.
- Next, enter the Grid Resolution, or size of grid, you wish to use. Note that this grid may be set to a custom or standard size.
- Select the OK button and the cursor becomes a grid. Hold down the left-mouse button and drag the grid so that the map being smoothed falls within desired grids. When the mouse button is released, a new view of the layer will be created and displayed.
Using the Average and Contour Method
The Average & Contour method of smoothing will give your map a smoothed appearance that will show distinct areas of your fields that fall within certain ranges. This method is useful for yields and moisture since it works well with small areas that contain a large number of points. Displaying an Averaged and Contoured view is faster than displaying Base Data.
To smooth data using the Average & Contour Method:
- Click on the Smoothingbutton found on the Layer Tools toolbar.
- In the Smoothing box select Average & Contour as the Method, and then select the Layer to smooth. This will default to the Active Layer.
- If the layer has data for more than one field, select the Field to be contoured. Select to contour all data on the layer.
Note: Contouring will only affect a single data item on the layer: moisture, for example. The affected item will be displayed in the Data Item box.
- Next, select Use Field boundaries or Use Points as boundaries. If fields are drawn on the Main Farming Layer, select Use Field and the contours will conform to the field boundaries. With Use Points selected, contours will not conform to the field boundaries.
- Next, enter the Grid Resolution, or size of grid, you wish to use. Note that this grid may be set to a custom or standard size.
Note: Grid Resolution will default to a 100 Foot grid. This is a normal grid size for yield maps. This number can be changed as desired. Smaller grid resolutions will give your contours a smoother appearance. However, it will also increase the time required for creating the contours.
- If desired, click on the Optionsbutton. In the Advanced Optionsbox, enter a Minimum Area for the contours. When creating the contoured areas, Farm Site and Site Pro will ignore all contours less than this area and will combine them with adjoining contours. Select OK.
- Select the OK button and the cursor becomes a grid. Hold down the left-mouse button and drag the grid so that the map being smoothed falls within desired grids. When the mouse button is released, a new view of the layer will be created and displayed.
Using the Smooth Method
Using the Smooth method will give your map a gridded appearance: each grid square will be filled with a weighted average for the data within and around that grid. Smoothing is useful for layers that have a small number of points in a large area, soil sample layers, for example. Displaying a Smoothed view is faster than displaying Base Data.
To smooth data using the Smooth Method:
- Click on the Smoothingbutton found on the Layer Tools toolbar.
- In the Smoothing box select Smooth as the Method, and then select the Layer to smooth. This defaults to the Active Layer.
- Select the Field to be averaged. Select to average all data on the layer. Next, select smooth points using the Field Boundaries based on the Main Farming Layer or Use Points. If fields are drawn on the Main Farming Layer, select Use Field and the grids will conform to the field boundaries. With Use Points selected, grids will not conform to the field boundaries.
Note: With Use Points, grid squares will only receive values if they have points within them. With Field Boundaries selected, the Smoothoption uses points that go beyond the selected grid squares; every grid will have a value assigned to it, regardless of points in the area.Use Fields must have a Field selected to smooth.
- Next, enter the Grid Resolution, or size of grid, you wish to use. Note that this grid may be set to a custom or standard size.
Note: Grid Resolution will default to a 100 Foot grid. This is a normal grid size for yield maps. This number can be changed as desired. Smaller grid resolutions will give your contours a smoother appearance. However, it will also increase the time required for creating the contours.
 Smoothview grids are calculated on a weighted average based on distances. To change variables used in the calculations, select theOptions button. The Advanced Optionsbox defaults to the typical settings for yield maps with a 1-acre grid. The grid should be changed if working with data other than yield or if using a Grid Resolution other than 1 acre. For more information on the Interpolation Methods utilized, see Interpolation Method Used For Smooth and Smooth & Contour Methods. Click OK.
- Select the OK button and the cursor becomes a grid. Hold down the left-mouse button and drag the grid so that the map being smoothed falls within desired grids. When the mouse button is released, a new view of the layer will be created and displayed.
Using the Smooth & Contour Method
The Smooth & Contour method of smoothing will give your map a smoothed appearance; each contour will be filled with a weighted average for the data within and around that contour. Smooth & Contour is useful for layers that have a small number of points in a large area: soil sample layers, for example. Displaying a Smooth & Contoured view is faster than displaying Base Data.
To smooth data using the Smooth & Contour Method:
- Click on the Smoothingbutton found on the Layer Tools toolbar.
- In the Smoothing box select Smooth & Contour as the Method, and then select the Layer to smooth. This defaults to the Active Layer.
- If the layer has data for more than one field, select the Field to be contoured. Select to contour all data on the layer. Next, select smooth points using the Field Boundaries based on the Main Farming Layer or Use Points. If fields are drawn on the Main Farming Layer, select Use Field and the contours will conform to the field boundaries. With Use Points selected, contours will not conform to the field boundaries.
Note: With Use Points, grid squares will only receive values if they have points within them. With Field Boundaries selected, the Smoothoption uses points that go beyond the selected grid squares; every grid will have a value assigned to it, regardless of points in the area.Use Fields must have a Field selected to smooth.
- Contouring will only affect a single data item on the layer. The affected item will be displayed in the Data Item box.
- Next, enter the Grid Resolution, or size of grid, you wish to use. Note that this size can be entered as an area or height/width of each grid square.
Note: Grid Resolution will default to a 100 Foot grid. This is a normal grid size for yield maps. This number can be changed as desired. Smaller grid resolutions will give your contours a smoother appearance. However, it will also increase the time required for creating the contours.
|
The Advanced Options box defaults to the typical settings for yield maps with a 1-acre grid. The grid should be changed if working with data other than yield or if using a Grid Resolution other than 1 acre. For more information on the Interpolation Methods utilized, see Interpolation Method Used For Smooth and Smooth & Contour Methods. Select OK.
- Select the OK button and the cursor becomes a grid. Hold down the left-mouse button and drag the grid so that the map being smoothed falls within desired grids. When the mouse button is released, a new view of the layer will be created and displayed.
Smoothing Over Defined Boundaries
You can Smooth point data and show averages for the data over drawn and defined areas (known as polygons) at any time. This option is useful for showing average yields for different areas of your farm: soil types, for example.
To create averaged data over defined boundaries:
- Make sure the area/polygon layer to which the data will be averaged is the Active Layer: a soil type layer, for example.
- Use the Pointer Tool to select the area(s) to average. To select more than one area, hold down the Shift or Ctrl key on your keyboard while clicking on each area. Alternately, click and drag to “rubber band” or lasso the areas you wish to select.
- Right-click on one of the selected areas and select Average Polygons from the menu.
- In the Average Polygons box, select the layer to be averaged. This will be the point-based layer, such as yield or soil test data.
- Select the OK button. The selected layer will have a new sublayer created with the averages for the selected polygon(s).
Advanced Options Box
The Advanced Options box will appear when you click on the Optionsbutton in the Smoothing box. The Advanced Options box is relevant to both Smoothed and Smoothed & Contoured views.
The following areas are accessible through the Options box:
- Number of Points to use in calculation:This is the number of points that the program will try to find within a set distance for the calculation. If this value is set too high it will slow down the time of the smoothing. If this value is set too low you will get inaccurate results. The value should be set to the number of points that can be found within a grid square.
- Ignore Data Points this distance away:The program will look a set distance for other points to include in the calculations. This value can be .75 to 1.5 times the size of the grid. Increasing this value may give you better results but will increase the time required for smoothing.
- Minimum Area:The minimum area is used for contour items only. When generating the polygon for each area, if the acres are less than this value, the polygon will be combined with a surrounding polygon.
Interpolation Method Used for Smooth and Smooth & Contour Methods
Farm Site and Site Pro use inversed distance to interpolate the value of each point within the grid. Simply put, when using the Smooth and Smooth & Contour Methods, each area will be filled with a weighted average for the data within and around that grid.
Specifically Farm Works creates a grid of the user-specified size. This is the Grid Resolution in the Smoothing box. The smaller the value, the more points will be created and the smoother the contour map will be. If the value is too large, some variations in the field will be lost.
The value of each grid point is determined by first finding the N closest actual sample points, where N is the value the user enters in the Smoothing Options box for Number of data points to use in calculation. Points that are too far away should not be considered as having an effect on the value at the point being calculated. The user can set this distance in the Ignore data points over this distance away box. These two options determine which points are used in the calculation.
Once the points to use in the calculation are determined, Farm Works uses the distance of each sample point from the point being calculated to weight its contribution to the final value. The amount each sample contributes is directly proportional to its distance away, i.e. inverse distance. For example, in the illustration to the right, Point B will affect X, or the Calculated Point, much more than Point A and Point C because of their greater distance from X. Only points within the Calculated Points’ grid will affect X.
Make Transparent Soil Layers
When creating a layer for soil data, check the “tranparent” box. This will allow you to see the underlying field map through the transparent soil layer.
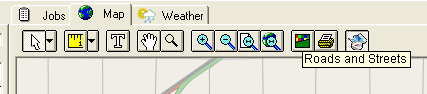
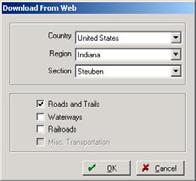
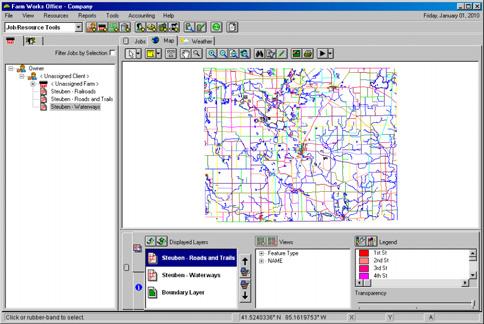
Downloading Roads & Waterways